Cinegraph
ストックにはログインが必要です
From spreadsheet to cinematic 3D data story
Design Tools
Artificial Intelligence
Data Visualization
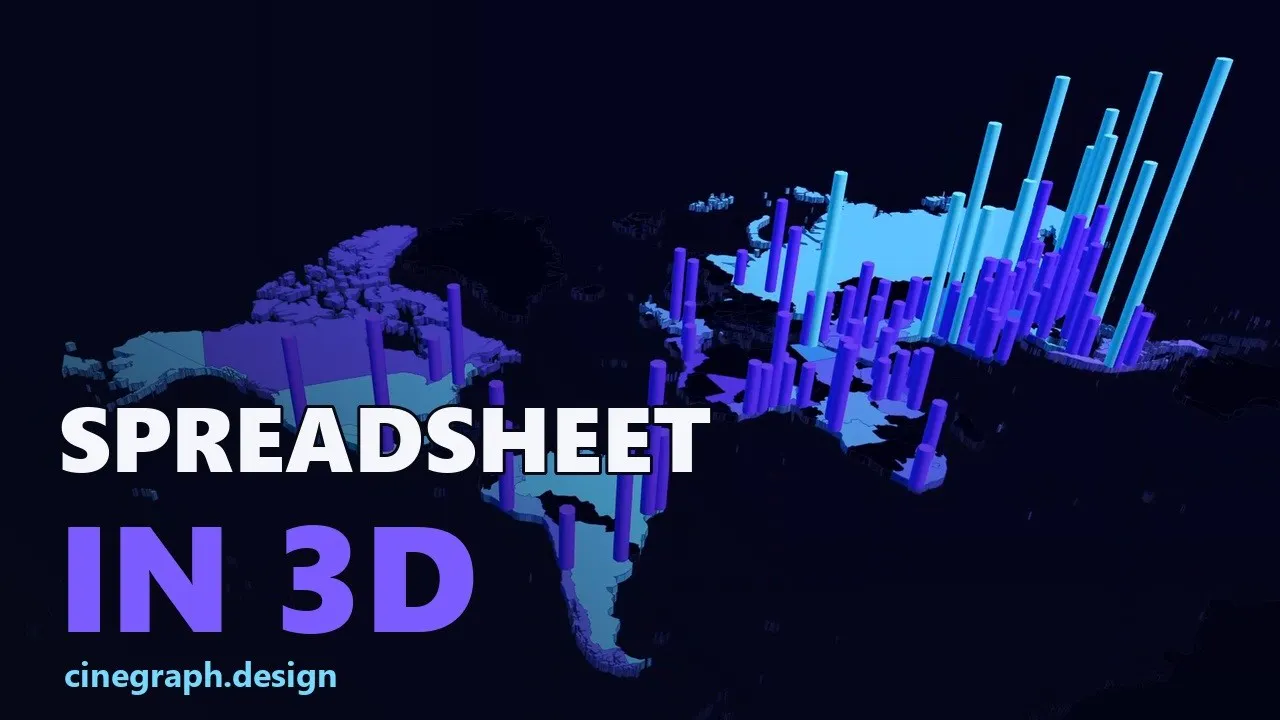
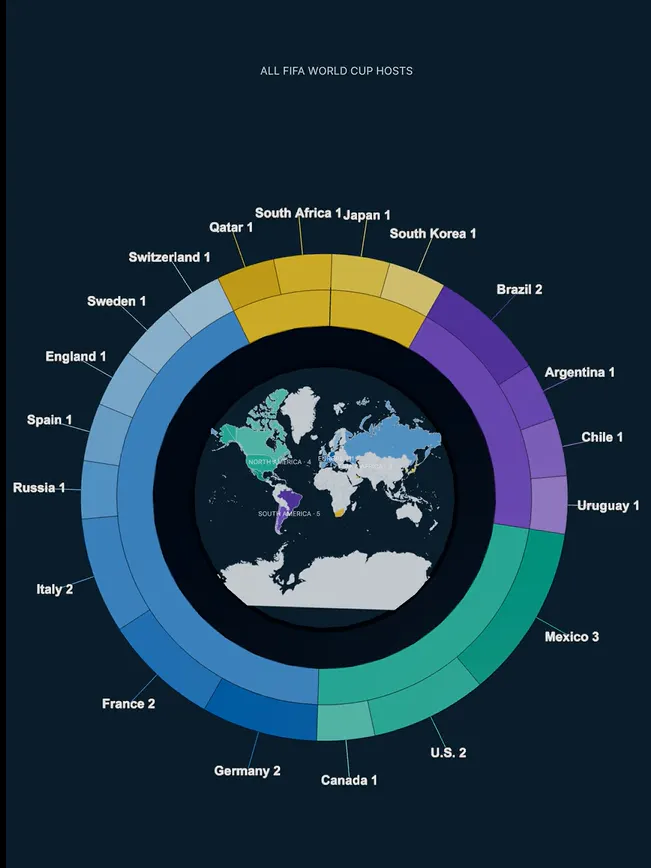
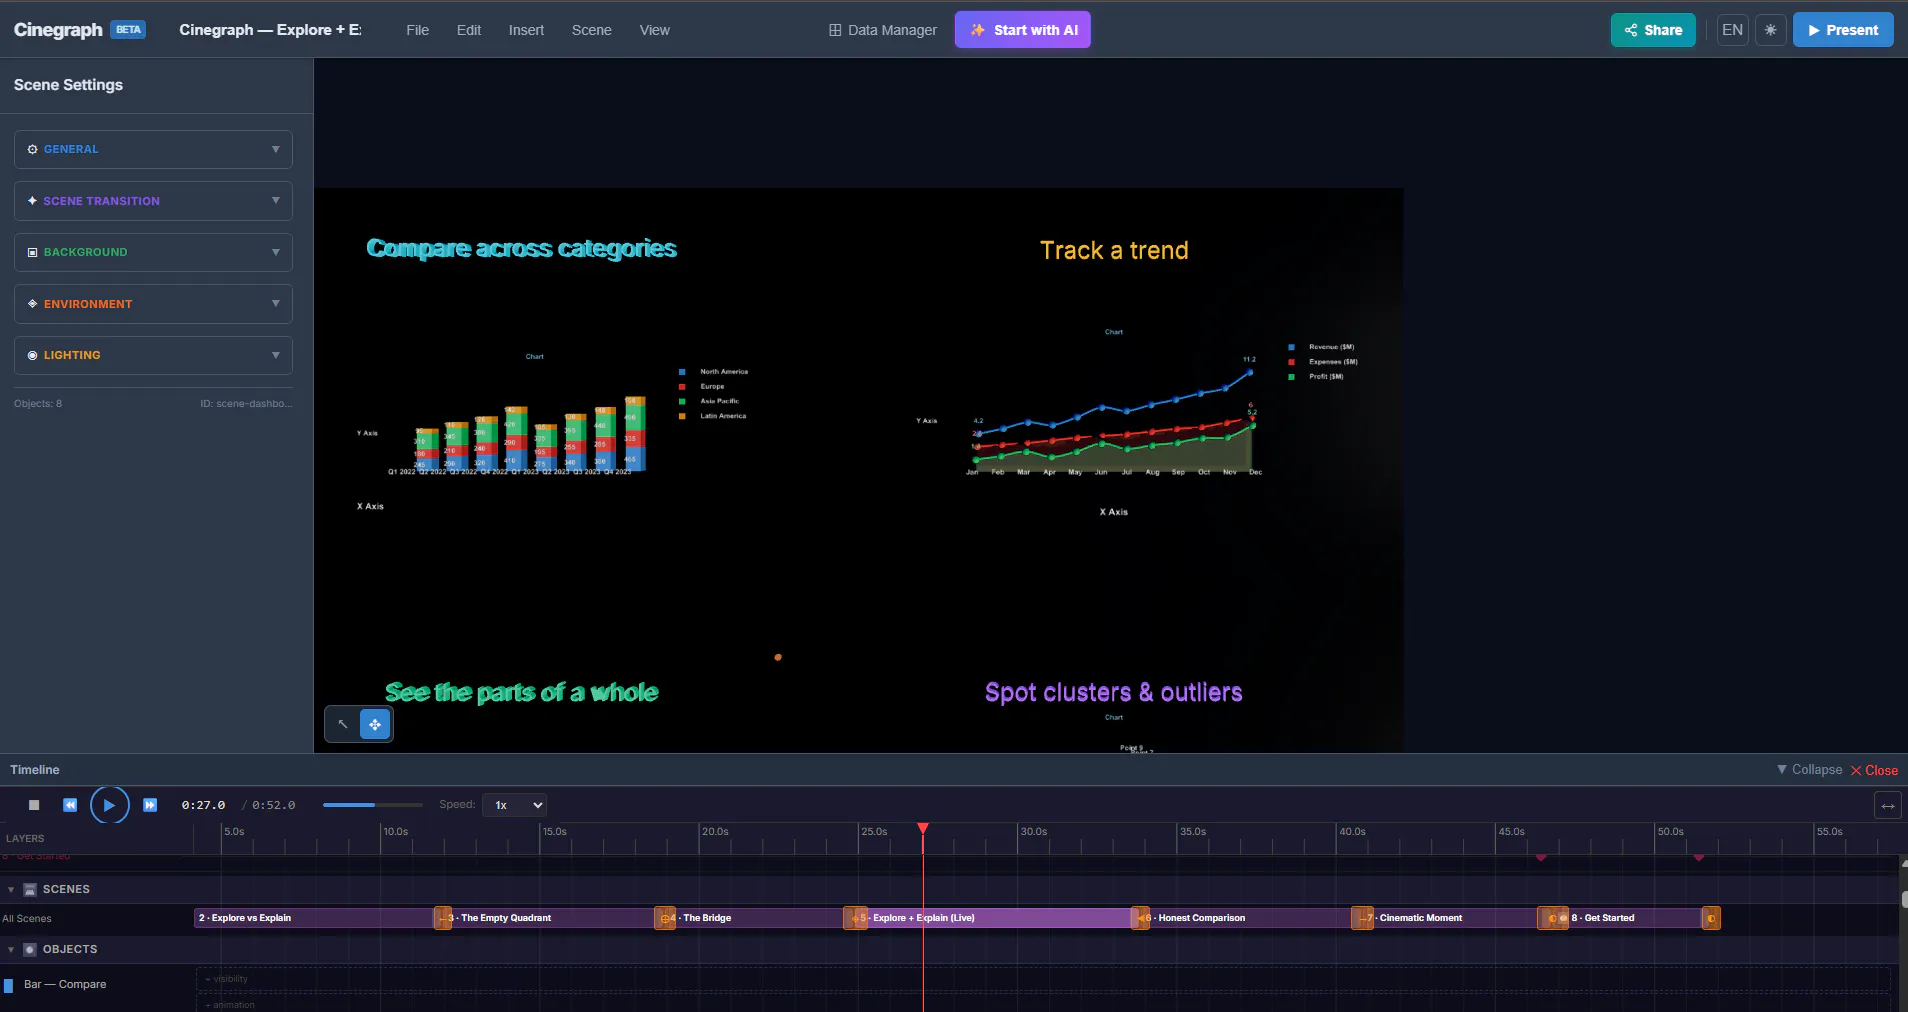
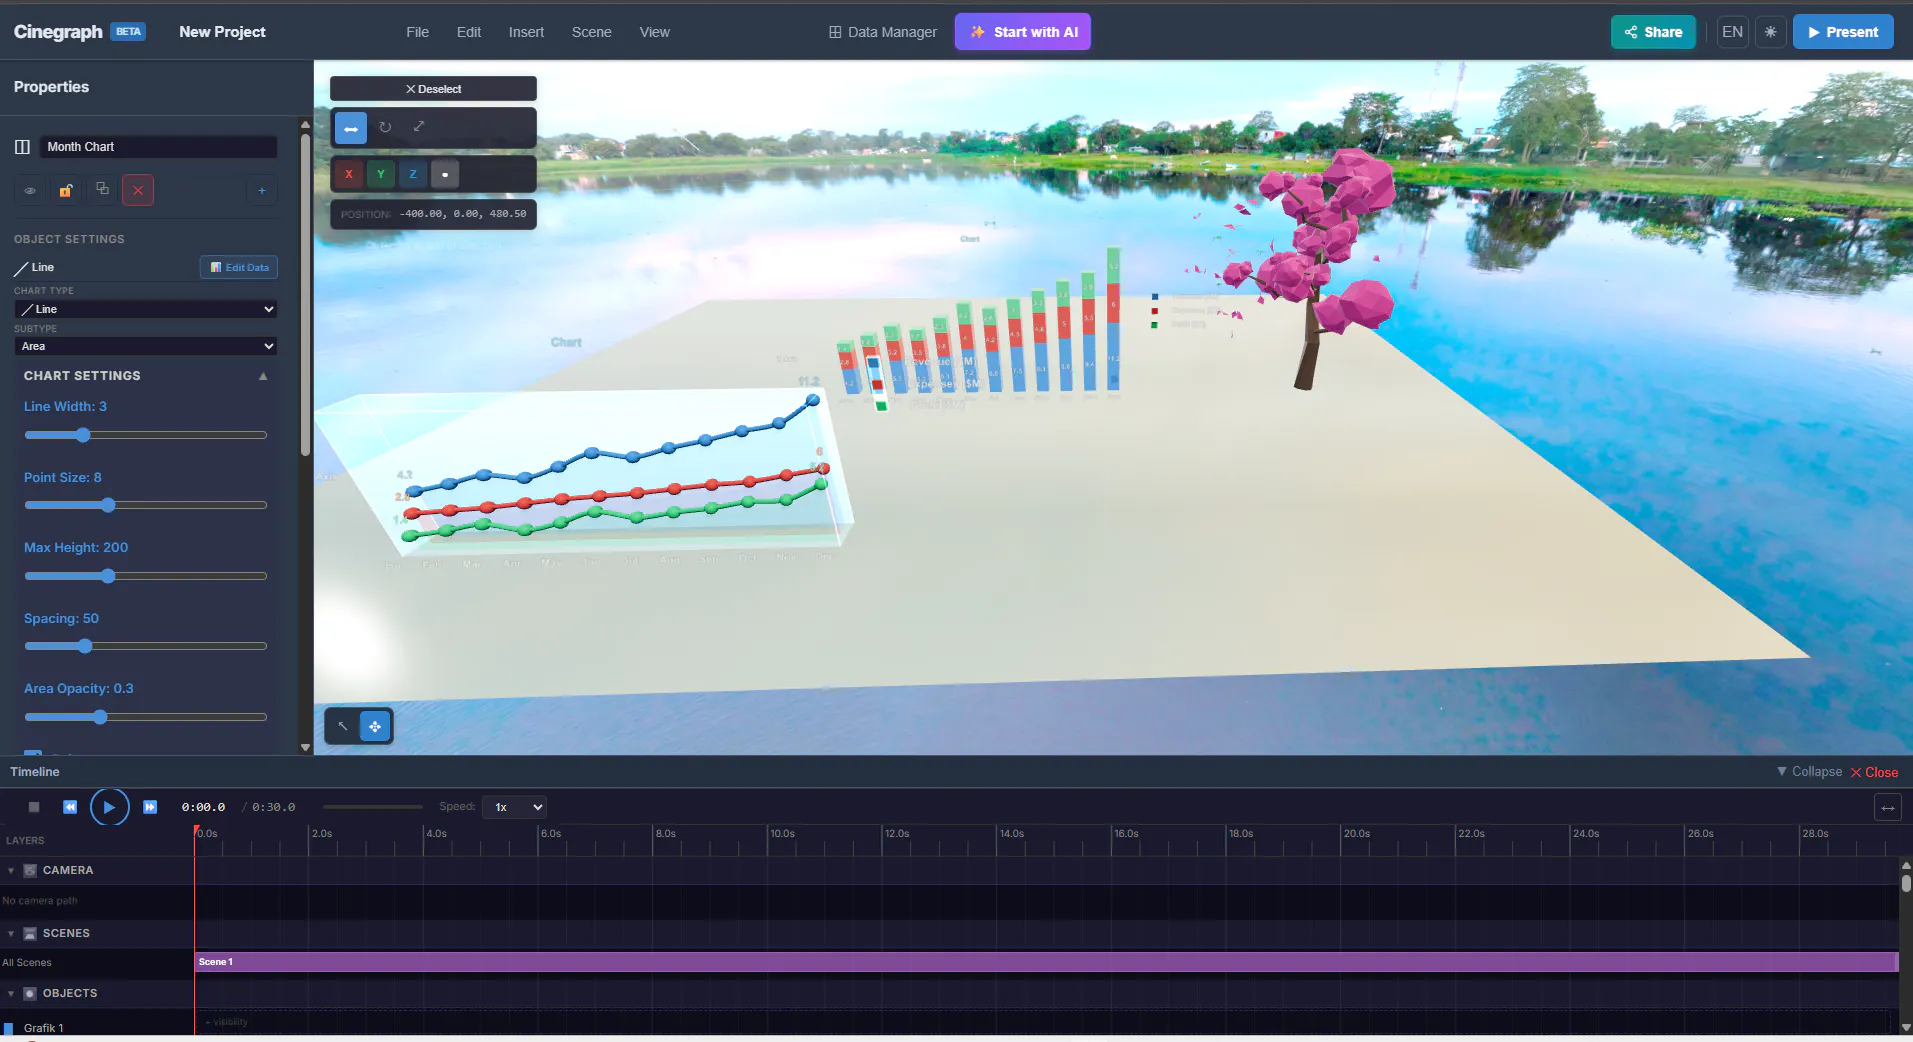
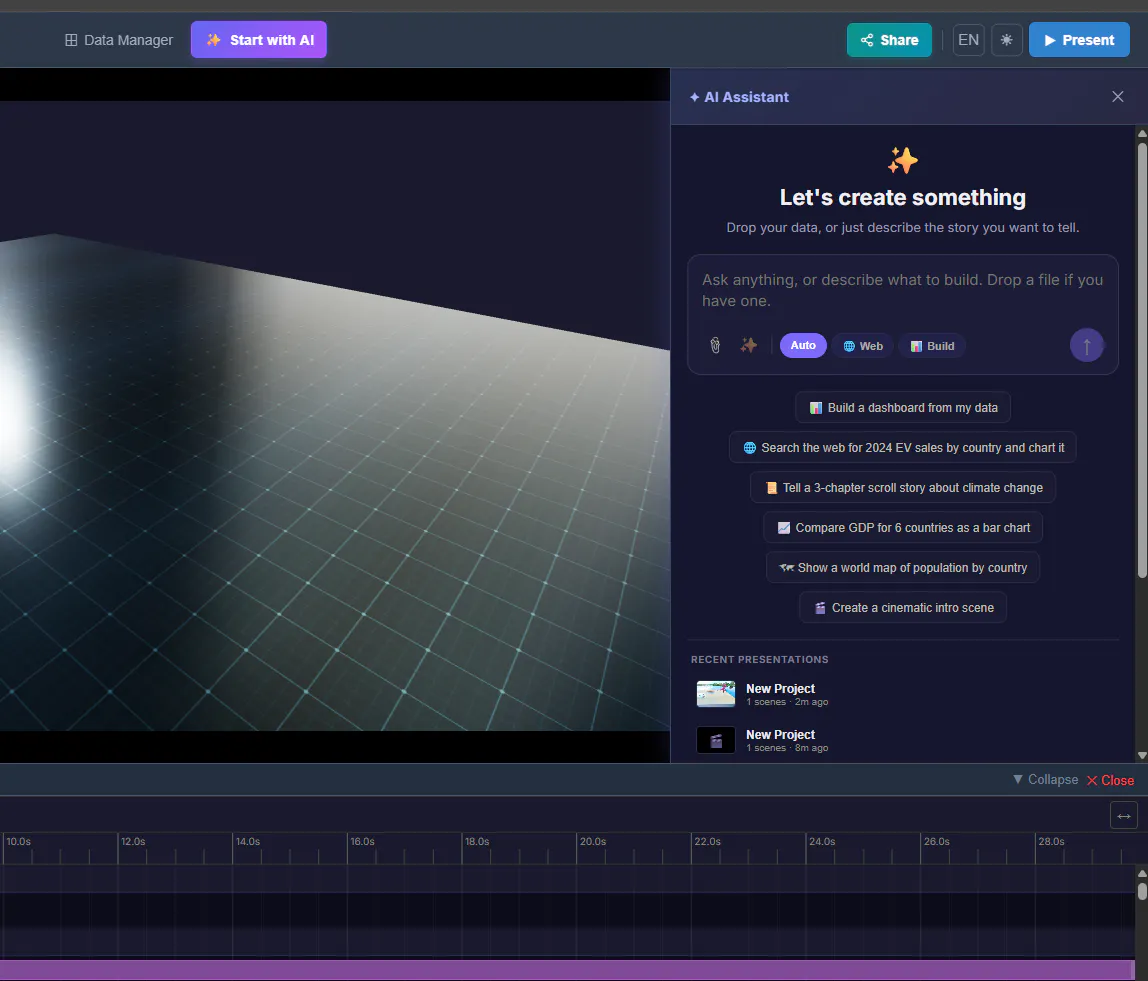
Cinegraph turns a spreadsheet into a cinematic 3D data story. Drop in Excel, CSV or JSON and get a real-time scene you direct like a shot: 37 chart types with 80 subtypes, camera paths, keyframe animation, lighting, scrollytelling. Publish it as a link, embed it, or export video up to 4K including TikTok and Reels sizes. Unlike chart builders it is directed, not templated; unlike motion tools the scene stays bound to your data, so changing a number changes the film. No code.
投票数: 0