Atlantis Charts — Visual Stock Screener
ストックにはログインが必要です
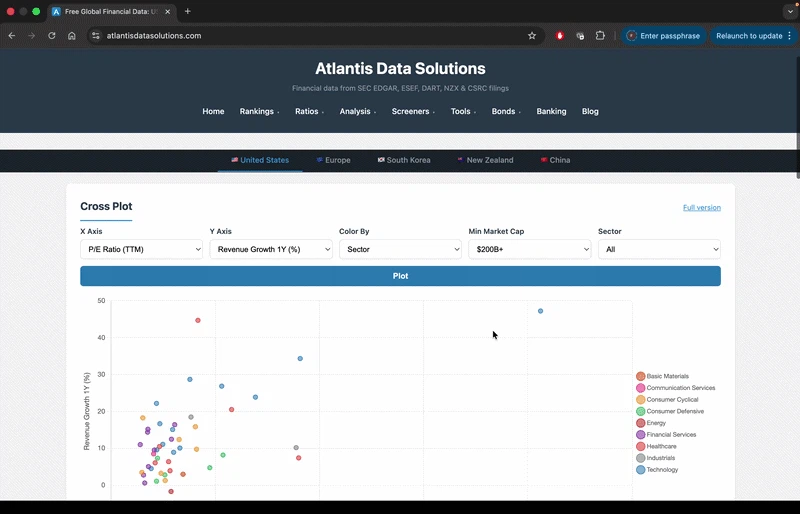
Start with the chart, then take a deep dive
Artificial Intelligence
Fintech
Investing
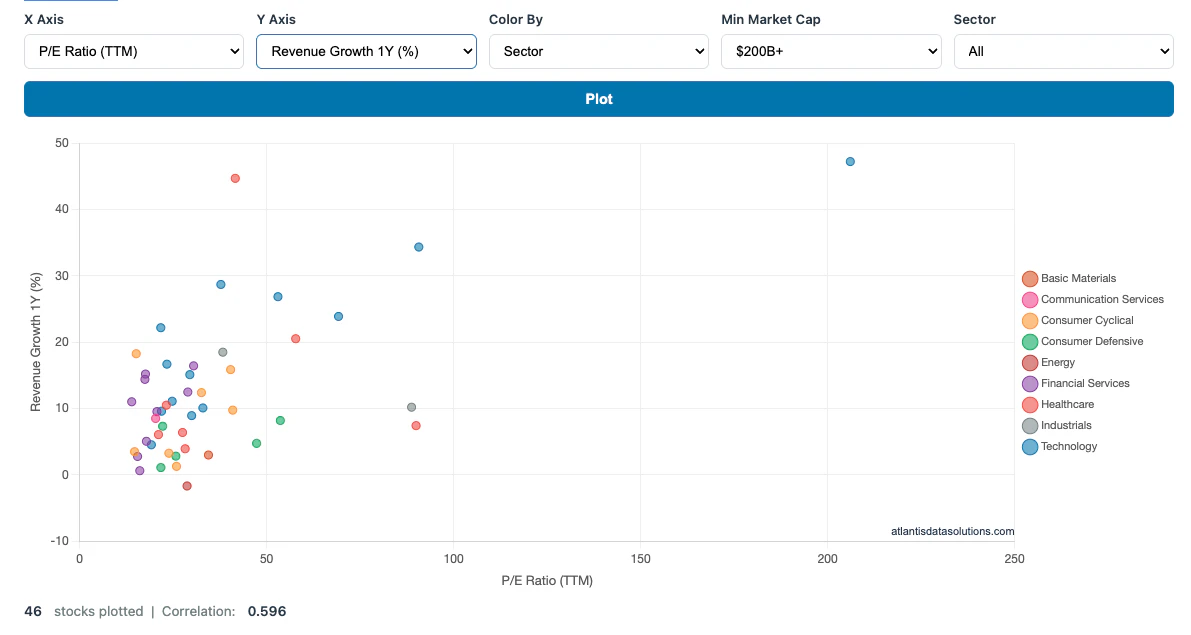
Start with the chart, and then go as deep as possible. The chart is a visual stock screener. If you click any of the dots, you can take a deep dive into any company's financial. We think we genuinely built the best financial analysis website out there. The data we are making available has been collected over almost a decade now. All from official filings. This was for stock data. The second problem we encountered was bond data for our actuarial models. It is already, but more on that later.
投票数: 1